


Congressional District 18, New York
About
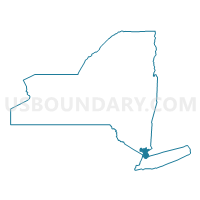
Outline

Summary
| Unique Area Identifier | 118824 |
| Name | Congressional District 18 |
| State | New York |
| Area (square miles) | 270.12 |
| Land Area (square miles) | 220.77 |
| Water Area (square miles) | 49.35 |
| % of Land Area | 81.73 |
| % of Water Area | 18.27 |
| Latitude of the Internal Point | 41.06465730 |
| Longtitude of the Internal Point | -73.79633120 |
| Total Population | 674,825 |
| Total Housing Units | 255,609 |
| Total Households | 241,424 |
| Median Age | 39.8 |
Maps
Graphs
Select a template below for downloading or customizing gragh for Congressional District 18, New York


Neighbors
Neighoring 111th Congressional District (by Name) Neighboring 111th Congressional District on the Map
- Congressional District 17, NY
- Congressional District 19, NY
- Congressional District 3, NY
- Congressional District 4, CT
- Congressional District 5, NY
- Congressional District 7, NY
Top 10 Neighboring County (by Population) Neighboring County on the Map
- Bronx County, NY (1,385,108)
- Nassau County, NY (1,339,532)
- Westchester County, NY (949,113)
- Fairfield County, CT (916,829)
- Rockland County, NY (311,687)
Top 10 Neighboring County Subdivision (by Population) Neighboring County Subdivision on the Map
- Bronx borough, Bronx County, NY (1,385,108)
- Oyster Bay town, Nassau County, NY (293,214)
- North Hempstead town, Nassau County, NY (226,322)
- Yonkers city, Westchester County, NY (195,976)
- Ramapo town, Rockland County, NY (126,595)
- Stamford town, Fairfield County, CT (122,643)
- Greenburgh town, Westchester County, NY (88,400)
- Clarkstown town, Rockland County, NY (84,187)
- New Rochelle city, Westchester County, NY (77,062)
- Mount Vernon city, Westchester County, NY (67,292)
Top 10 Neighboring Place (by Population) Neighboring Place on the Map
- New York city, NY (8,175,133)
- Yonkers city, NY (195,976)
- Stamford city, CT (122,643)
- New Rochelle city, NY (77,062)
- Mount Vernon city, NY (67,292)
- White Plains city, NY (56,853)
- New City CDP, NY (33,559)
- Port Chester village, NY (28,967)
- Harrison village, NY (27,472)
- Glen Cove city, NY (26,964)
Top 10 Neighboring Unified School District (by Population) Neighboring Unified School District on the Map
- New York City Department Of Education, NY (8,175,133)
- Yonkers City School District, NY (195,976)
- Stamford School District, CT (122,643)
- East Ramapo Central School District, NY (113,031)
- New Rochelle City School District, NY (77,062)
- Mount Vernon City School District, NY (67,292)
- Greenwich School District, CT (61,171)
- White Plains City School District, NY (56,853)
- Clarkstown Central School District, NY (48,526)
- Haverstraw-Stony Point Central School District, NY (47,775)
Top 10 Neighboring State Legislative District Lower Chamber (by Population) Neighboring State Legislative District Lower Chamber on the Map
- Assembly District 95, NY (145,915)
- Assembly District 96, NY (138,725)
- Assembly District 90, NY (137,827)
- Assembly District 94, NY (135,492)
- Assembly District 99, NY (134,814)
- Assembly District 16, NY (134,747)
- Assembly District 92, NY (133,416)
- Assembly District 87, NY (132,139)
- Assembly District 13, NY (131,694)
- Assembly District 88, NY (131,096)
Top 10 Neighboring State Legislative District Upper Chamber (by Population) Neighboring State Legislative District Upper Chamber on the Map
- State Senate District 38, NY (347,376)
- State Senate District 36, NY (328,256)
- State Senate District 37, NY (326,645)
- State Senate District 5, NY (316,844)
- State Senate District 40, NY (316,324)
- State Senate District 34, NY (315,408)
- State Senate District 35, NY (313,382)
- State Senate District 7, NY (311,141)
- State Senate District 36, CT (96,890)
Top 10 Neighboring Census Tract (by Population) Neighboring Census Tract on the Map
- Census Tract 79, Westchester County, NY (7,930)
- Census Tract 115.02, Rockland County, NY (7,629)
- Census Tract 92, Westchester County, NY (7,065)
- Census Tract 122, Westchester County, NY (7,019)
- Census Tract 6, Westchester County, NY (6,977)
- Census Tract 105, Westchester County, NY (6,959)
- Census Tract 82, Westchester County, NY (6,931)
- Census Tract 128.02, Westchester County, NY (6,899)
- Census Tract 105.02, Rockland County, NY (6,871)
- Census Tract 116, Westchester County, NY (6,848)
Top 10 Neighboring 5-Digit ZIP Code Tabulation Area (by Population) Neighboring 5-Digit ZIP Code Tabulation Area on the Map
- 10466, NY (67,813)
- 10701, NY (63,393)
- 10475, NY (40,931)
- 10801, NY (40,827)
- 10583, NY (38,982)
- 10705, NY (38,777)
- 10573, NY (38,352)
- 10550, NY (37,144)
- 10562, NY (31,796)
- 10956, NY (31,521)
Data
Demographic, Population, Households, and Housing Units
** Data sources from census 2010 **
Show Data on Map
Download Full List as CSV
Download Quick Sheet as CSV
| Subject | This Area | New York | National |
|---|---|---|---|
| POPULATION | |||
| Total Population Map | 674,825 | 19,378,102 | 308,745,538 |
| POPULATION, HISPANIC OR LATINO ORIGIN | |||
| Not Hispanic or Latino Map | 522,023 | 15,961,180 | 258,267,944 |
| Hispanic or Latino Map | 152,802 | 3,416,922 | 50,477,594 |
| POPULATION, RACE | |||
| White alone Map | 480,876 | 12,740,974 | 223,553,265 |
| Black or African American alone Map | 69,368 | 3,073,800 | 38,929,319 |
| American Indian and Alaska Native alone Map | 2,708 | 106,906 | 2,932,248 |
| Asian alone Map | 43,990 | 1,420,244 | 14,674,252 |
| Native Hawaiian and Other Pacific Islander alone Map | 267 | 8,766 | 540,013 |
| Some Other Race alone Map | 56,731 | 1,441,563 | 19,107,368 |
| Two or More Races Map | 20,885 | 585,849 | 9,009,073 |
| POPULATION, SEX | |||
| Male Map | 326,892 | 9,377,147 | 151,781,326 |
| Female Map | 347,933 | 10,000,955 | 156,964,212 |
| POPULATION, AGE (18 YEARS) | |||
| 18 years and over Map | 511,817 | 15,053,173 | 234,564,071 |
| Under 18 years | 163,008 | 4,324,929 | 74,181,467 |
| POPULATION, AGE | |||
| Under 5 years | 40,280 | 1,155,822 | 20,201,362 |
| 5 to 9 years | 45,541 | 1,163,955 | 20,348,657 |
| 10 to 14 years | 47,292 | 1,211,456 | 20,677,194 |
| 15 to 17 years | 29,895 | 793,696 | 12,954,254 |
| 18 and 19 years | 17,316 | 572,582 | 9,086,089 |
| 20 years | 7,823 | 293,083 | 4,519,129 |
| 21 years | 7,695 | 281,596 | 4,354,294 |
| 22 to 24 years | 23,194 | 836,256 | 12,712,576 |
| 25 to 29 years | 37,220 | 1,380,177 | 21,101,849 |
| 30 to 34 years | 39,065 | 1,279,160 | 19,962,099 |
| 35 to 39 years | 43,578 | 1,254,124 | 20,179,642 |
| 40 to 44 years | 50,500 | 1,355,893 | 20,890,964 |
| 45 to 49 years | 53,324 | 1,458,763 | 22,708,591 |
| 50 to 54 years | 51,030 | 1,419,928 | 22,298,125 |
| 55 to 59 years | 43,842 | 1,237,408 | 19,664,805 |
| 60 and 61 years | 15,845 | 453,993 | 7,113,727 |
| 62 to 64 years | 21,785 | 612,267 | 9,704,197 |
| 65 and 66 years | 11,773 | 330,160 | 5,319,902 |
| 67 to 69 years | 16,109 | 443,051 | 7,115,361 |
| 70 to 74 years | 21,447 | 587,391 | 9,278,166 |
| 75 to 79 years | 18,565 | 474,807 | 7,317,795 |
| 80 to 84 years | 15,870 | 391,660 | 5,743,327 |
| 85 years and over | 15,836 | 390,874 | 5,493,433 |
| MEDIAN AGE BY SEX | |||
| Both sexes Map | 39.80 | 38.00 | 37.20 |
| Male Map | 38.10 | 36.30 | 35.80 |
| Female Map | 41.40 | 39.40 | 38.50 |
| HOUSEHOLDS | |||
| Total Households Map | 241,424 | 7,317,755 | 116,716,292 |
| HOUSEHOLDS, HOUSEHOLD TYPE | |||
| Family households: Map | 167,945 | 4,649,791 | 77,538,296 |
| Husband-wife family Map | 130,214 | 3,192,903 | 56,510,377 |
| Other family: Map | 37,731 | 1,456,888 | 21,027,919 |
| Male householder, no wife present Map | 9,869 | 366,948 | 5,777,570 |
| Female householder, no husband present Map | 27,862 | 1,089,940 | 15,250,349 |
| Nonfamily households: Map | 73,479 | 2,667,964 | 39,177,996 |
| Householder living alone Map | 62,634 | 2,130,670 | 31,204,909 |
| Householder not living alone Map | 10,845 | 537,294 | 7,973,087 |
| HOUSEHOLDS, HISPANIC OR LATINO ORIGIN OF HOUSEHOLDER | |||
| Not Hispanic or Latino householder: Map | 201,067 | 6,311,241 | 103,254,926 |
| Hispanic or Latino householder: Map | 40,357 | 1,006,514 | 13,461,366 |
| HOUSEHOLDS, RACE OF HOUSEHOLDER | |||
| Householder who is White alone | 183,112 | 5,169,163 | 89,754,352 |
| Householder who is Black or African American alone | 24,398 | 1,095,790 | 14,129,983 |
| Householder who is American Indian and Alaska Native alone | 718 | 33,824 | 939,707 |
| Householder who is Asian alone | 13,709 | 445,652 | 4,632,164 |
| Householder who is Native Hawaiian and Other Pacific Islander alone | 71 | 2,615 | 143,932 |
| Householder who is Some Other Race alone | 14,305 | 405,320 | 4,916,427 |
| Householder who is Two or More Races | 5,111 | 165,391 | 2,199,727 |
| HOUSEHOLDS, HOUSEHOLD TYPE BY HOUSEHOLD SIZE | |||
| Family households: Map | 167,945 | 4,649,791 | 77,538,296 |
| 2-person household Map | 60,268 | 1,785,206 | 31,882,616 |
| 3-person household Map | 38,709 | 1,109,716 | 17,765,829 |
| 4-person household Map | 38,852 | 944,590 | 15,214,075 |
| 5-person household Map | 18,561 | 461,667 | 7,411,997 |
| 6-person household Map | 6,739 | 189,577 | 3,026,278 |
| 7-or-more-person household Map | 4,816 | 159,035 | 2,237,501 |
| Nonfamily households: Map | 73,479 | 2,667,964 | 39,177,996 |
| 1-person household Map | 62,634 | 2,130,670 | 31,204,909 |
| 2-person household Map | 8,727 | 430,564 | 6,360,012 |
| 3-person household Map | 1,091 | 66,787 | 992,156 |
| 4-person household Map | 542 | 24,877 | 411,171 |
| 5-person household Map | 242 | 8,596 | 126,634 |
| 6-person household Map | 133 | 3,400 | 48,421 |
| 7-or-more-person household Map | 110 | 3,070 | 34,693 |
| HOUSING UNITS | |||
| Total Housing Units Map | 255,609 | 8,108,103 | 131,704,730 |
| HOUSING UNITS, OCCUPANCY STATUS | |||
| Occupied Map | 241,424 | 7,317,755 | 116,716,292 |
| Vacant Map | 14,185 | 790,348 | 14,988,438 |
| HOUSING UNITS, OCCUPIED, TENURE | |||
| Owned with a mortgage or a loan Map | 108,150 | 2,610,123 | 52,979,430 |
| Owned free and clear Map | 48,465 | 1,287,714 | 23,006,644 |
| Renter occupied Map | 84,809 | 3,419,918 | 40,730,218 |
| HOUSING UNITS, VACANT, VACANCY STATUS | |||
| For rent Map | 4,567 | 200,039 | 4,137,567 |
| Rented, not occupied Map | 281 | 12,786 | 206,825 |
| For sale only Map | 2,522 | 77,225 | 1,896,796 |
| Sold, not occupied Map | 607 | 21,027 | 421,032 |
| For seasonal, recreational, or occasional use Map | 1,649 | 289,301 | 4,649,298 |
| For migrant workers Map | 2 | 892 | 24,161 |
| Other vacant Map | 4,557 | 189,078 | 3,652,759 |
| HOUSING UNITS, OCCUPIED, AVERAGE HOUSEHOLD SIZE BY TENURE | |||
| Total: Map | 2.70 | 2.57 | 2.58 |
| Owner occupied Map | 2.76 | 2.71 | 2.65 |
| Renter occupied Map | 2.59 | 2.41 | 2.44 |
| HOUSING UNITS, OCCUPIED, TENURE BY RACE OF HOUSEHOLDER | |||
| Owner occupied: Map | 156,615 | 3,897,837 | 75,986,074 |
| Householder who is White alone Map | 132,824 | 3,237,592 | 63,446,275 |
| Householder who is Black or African American alone Map | 9,393 | 325,395 | 6,261,464 |
| Householder who is American Indian and Alaska Native alone Map | 196 | 11,250 | 509,588 |
| Householder who is Asian alone Map | 8,609 | 197,011 | 2,688,861 |
| Householder who is Native Hawaiian and Other Pacific Islander alone Map | 26 | 741 | 61,911 |
| Householder who is Some Other Race alone Map | 3,563 | 74,243 | 1,975,817 |
| Householder who is Two or More Races Map | 2,004 | 51,605 | 1,042,158 |
| Renter occupied: Map | 84,809 | 3,419,918 | 40,730,218 |
| Householder who is White alone Map | 50,288 | 1,931,571 | 26,308,077 |
| Householder who is Black or African American alone Map | 15,005 | 770,395 | 7,868,519 |
| Householder who is American Indian and Alaska Native alone Map | 522 | 22,574 | 430,119 |
| Householder who is Asian alone Map | 5,100 | 248,641 | 1,943,303 |
| Householder who is Native Hawaiian and Other Pacific Islander alone Map | 45 | 1,874 | 82,021 |
| Householder who is Some Other Race alone Map | 10,742 | 331,077 | 2,940,610 |
| Householder who is Two or More Races Map | 3,107 | 113,786 | 1,157,569 |
| HOUSING UNITS, OCCUPIED, TENURE BY HISPANIC OR LATINO ORIGIN OF HOUSEHOLDER | |||
| Owner occupied: Map | 156,615 | 3,897,837 | 75,986,074 |
| Not Hispanic or Latino householder Map | 143,492 | 3,664,784 | 69,617,625 |
| Hispanic or Latino householder Map | 13,123 | 233,053 | 6,368,449 |
| Renter occupied: Map | 84,809 | 3,419,918 | 40,730,218 |
| Not Hispanic or Latino householder Map | 57,575 | 2,646,457 | 33,637,301 |
| Hispanic or Latino householder Map | 27,234 | 773,461 | 7,092,917 |
| HOUSING UNITS, OCCUPIED, TENURE BY HOUSEHOLD SIZE | |||
| Owner occupied: Map | 156,615 | 3,897,837 | 75,986,074 |
| 1-person household Map | 33,486 | 860,611 | 16,453,569 |
| 2-person household Map | 48,642 | 1,304,752 | 27,618,605 |
| 3-person household Map | 26,661 | 660,251 | 12,517,563 |
| 4-person household Map | 28,216 | 606,580 | 10,998,793 |
| 5-person household Map | 13,028 | 279,929 | 5,057,765 |
| 6-person household Map | 4,151 | 106,323 | 1,965,796 |
| 7-or-more-person household Map | 2,431 | 79,391 | 1,373,983 |
| Renter occupied: Map | 84,809 | 3,419,918 | 40,730,218 |
| 1-person household Map | 29,148 | 1,270,059 | 14,751,340 |
| 2-person household Map | 20,353 | 911,018 | 10,624,023 |
| 3-person household Map | 13,139 | 516,252 | 6,240,422 |
| 4-person household Map | 11,178 | 362,887 | 4,626,453 |
| 5-person household Map | 5,775 | 190,334 | 2,480,866 |
| 6-person household Map | 2,721 | 86,654 | 1,108,903 |
| 7-or-more-person household Map | 2,495 | 82,714 | 898,211 |
Loading...